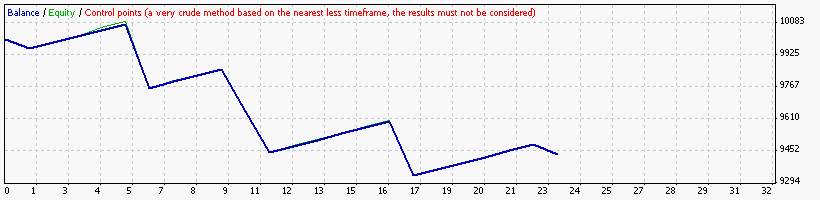
Strategy Tester Report
Join the dots
AlpariUK-Demo (Build 226)
| Symbol | EURUSD (Euro vs US Dollar) | ||||
| Period | 1 Hour (H1) 2010.05.03 00:00 - 2010.05.31 00:00 (2010.05.01 - 2010.05.31) | ||||
| Model | Control points (a very crude method, the results must not be considered) | ||||
| Parameters | ExpertID=994488; TakeProfit=300; StopLoss=50; LotSize=0.1; useStopLoss=false; Slippage=10; BuyComment=""Join"; SellComment=""Join"; | ||||
| Bars in test | 1478 | Ticks modelled | 12947 | Modelling quality | n/a |
| Mismatched charts errors | 1 | ||||
| Initial deposit | 10000.00 | ||||
| Total net profit | -563.43 | Gross profit | 509.83 | Gross loss | -1073.26 |
| Profit factor | 0.48 | Expected payoff | -24.50 | ||
| Absolute drawdown | 817.66 | Maximal drawdown | 904.55 (8.97%) | Relative drawdown | 8.97% (904.55) |
| Total trades | 23 | Short positions (won %) | 7 (85.71%) | Long positions (won %) | 16 (68.75%) |
| Profit trades (% of total) | 17 (73.91%) | Loss trades (% of total) | 6 (26.09%) | ||
| Largest | profit trade | 30.00 | loss trade | -313.02 | |
| Average | profit trade | 29.99 | loss trade | -178.88 | |
| Maximum | consecutive wins (profit in money) | 5 (150.00) | consecutive losses (loss in money) | 2 (-406.62) | |
| Maximal | consecutive profit (count of wins) | 150.00 (5) | consecutive loss (count of losses) | -406.62 (2) | |
| Average | consecutive wins | 4 | consecutive losses | 1 | |
| # | Time | Type | Order | Size | Price | S / L | T / P | Profit | Balance |
| 1 | 2010.05.03 03:15 | buy | 1 | 0.10 | 1.32455 | 0.00000 | 1.32755 | ||
| 2 | 2010.05.04 02:40 | close | 1 | 0.10 | 1.32011 | 0.00000 | 1.32755 | -44.51 | 9955.49 |
| 3 | 2010.05.04 02:40 | sell | 2 | 0.10 | 1.32011 | 0.00000 | 1.31711 | ||
| 4 | 2010.05.04 08:20 | t/p | 2 | 0.10 | 1.31711 | 0.00000 | 1.31711 | 30.00 | 9985.49 |
| 5 | 2010.05.05 18:00 | sell | 3 | 0.10 | 1.28904 | 0.00000 | 1.28604 | ||
| 6 | 2010.05.05 19:45 | t/p | 3 | 0.10 | 1.28604 | 0.00000 | 1.28604 | 30.00 | 10015.49 |
| 7 | 2010.05.10 03:02 | buy | 4 | 0.10 | 1.28143 | 0.00000 | 1.28443 | ||
| 8 | 2010.05.10 03:15 | t/p | 4 | 0.10 | 1.28443 | 0.00000 | 1.28443 | 30.00 | 10045.49 |
| 9 | 2010.05.10 03:15 | buy | 5 | 0.10 | 1.28617 | 0.00000 | 1.28917 | ||
| 10 | 2010.05.10 04:10 | t/p | 5 | 0.10 | 1.28917 | 0.00000 | 1.28917 | 30.00 | 10075.49 |
| 11 | 2010.05.10 13:45 | buy | 6 | 0.10 | 1.29770 | 0.00000 | 1.30070 | ||
| 12 | 2010.05.12 09:20 | close | 6 | 0.10 | 1.26642 | 0.00000 | 1.30070 | -313.02 | 9762.47 |
| 13 | 2010.05.12 09:20 | sell | 7 | 0.10 | 1.26642 | 0.00000 | 1.26342 | ||
| 14 | 2010.05.12 17:20 | t/p | 7 | 0.10 | 1.26342 | 0.00000 | 1.26342 | 30.00 | 9792.47 |
| 15 | 2010.05.13 01:40 | sell | 8 | 0.10 | 1.26416 | 0.00000 | 1.26116 | ||
| 16 | 2010.05.13 10:33 | t/p | 8 | 0.10 | 1.26116 | 0.00000 | 1.26116 | 30.00 | 9822.47 |
| 17 | 2010.05.17 15:15 | sell | 9 | 0.10 | 1.23805 | 0.00000 | 1.23505 | ||
| 18 | 2010.05.17 16:45 | t/p | 9 | 0.10 | 1.23505 | 0.00000 | 1.23505 | 30.00 | 9852.47 |
| 19 | 2010.05.18 17:37 | buy | 10 | 0.10 | 1.23819 | 0.00000 | 1.24119 | ||
| 20 | 2010.05.19 09:15 | close | 10 | 0.10 | 1.21759 | 0.00000 | 1.24119 | -206.11 | 9646.36 |
| 21 | 2010.05.19 09:15 | sell | 11 | 0.10 | 1.21759 | 0.00000 | 1.21459 | ||
| 22 | 2010.05.20 02:10 | close | 11 | 0.10 | 1.23759 | 0.00000 | 1.21459 | -200.51 | 9445.85 |
| 23 | 2010.05.20 02:10 | buy | 12 | 0.10 | 1.23759 | 0.00000 | 1.24059 | ||
| 24 | 2010.05.20 08:45 | t/p | 12 | 0.10 | 1.24059 | 0.00000 | 1.24059 | 30.00 | 9475.85 |
| 25 | 2010.05.20 16:20 | buy | 13 | 0.10 | 1.22964 | 0.00000 | 1.23264 | ||
| 26 | 2010.05.20 16:40 | t/p | 13 | 0.10 | 1.23264 | 0.00000 | 1.23264 | 30.00 | 9505.85 |
| 27 | 2010.05.20 16:40 | buy | 14 | 0.10 | 1.23316 | 0.00000 | 1.23616 | ||
| 28 | 2010.05.20 17:20 | t/p | 14 | 0.10 | 1.23616 | 0.00000 | 1.23616 | 30.00 | 9535.85 |
| 29 | 2010.05.21 10:20 | buy | 15 | 0.10 | 1.24710 | 0.00000 | 1.25010 | ||
| 30 | 2010.05.21 10:45 | t/p | 15 | 0.10 | 1.25010 | 0.00000 | 1.25010 | 30.00 | 9565.85 |
| 31 | 2010.05.21 10:45 | buy | 16 | 0.10 | 1.25105 | 0.00000 | 1.25405 | ||
| 32 | 2010.05.21 11:15 | t/p | 16 | 0.10 | 1.25405 | 0.00000 | 1.25405 | 30.00 | 9595.85 |
| 33 | 2010.05.24 02:50 | buy | 17 | 0.10 | 1.25016 | 0.00000 | 1.25316 | ||
| 34 | 2010.05.25 16:05 | close | 17 | 0.10 | 1.22380 | 0.00000 | 1.25316 | -263.71 | 9332.14 |
| 35 | 2010.05.25 16:05 | sell | 18 | 0.10 | 1.22380 | 0.00000 | 1.22080 | ||
| 36 | 2010.05.26 17:15 | t/p | 18 | 0.10 | 1.22080 | 0.00000 | 1.22080 | 29.83 | 9361.97 |
| 37 | 2010.05.28 03:15 | buy | 19 | 0.10 | 1.23094 | 0.00000 | 1.23394 | ||
| 38 | 2010.05.28 08:40 | t/p | 19 | 0.10 | 1.23394 | 0.00000 | 1.23394 | 30.00 | 9391.97 |
| 39 | 2010.05.28 17:02 | buy | 20 | 0.10 | 1.23150 | 0.00000 | 1.23450 | ||
| 40 | 2010.05.28 17:20 | t/p | 20 | 0.10 | 1.23450 | 0.00000 | 1.23450 | 30.00 | 9421.97 |
| 41 | 2010.05.28 17:20 | buy | 21 | 0.10 | 1.23457 | 0.00000 | 1.23757 | ||
| 42 | 2010.05.28 18:15 | t/p | 21 | 0.10 | 1.23757 | 0.00000 | 1.23757 | 30.00 | 9451.97 |
| 43 | 2010.05.28 18:50 | buy | 22 | 0.10 | 1.22836 | 0.00000 | 1.23136 | ||
| 44 | 2010.05.28 18:57 | t/p | 22 | 0.10 | 1.23136 | 0.00000 | 1.23136 | 30.00 | 9481.97 |
| 45 | 2010.05.28 18:57 | buy | 23 | 0.10 | 1.23155 | 0.00000 | 1.23455 | ||
| 46 | 2010.05.28 22:59 | close at stop | 23 | 0.10 | 1.22701 | 0.00000 | 1.23455 | -45.40 | 9436.57 |